Business Intelligence Dashboards for Data-Driven Decisions
Business Intelligence Dashboards: Making Decisions on Numbers, Not Gut Feeling
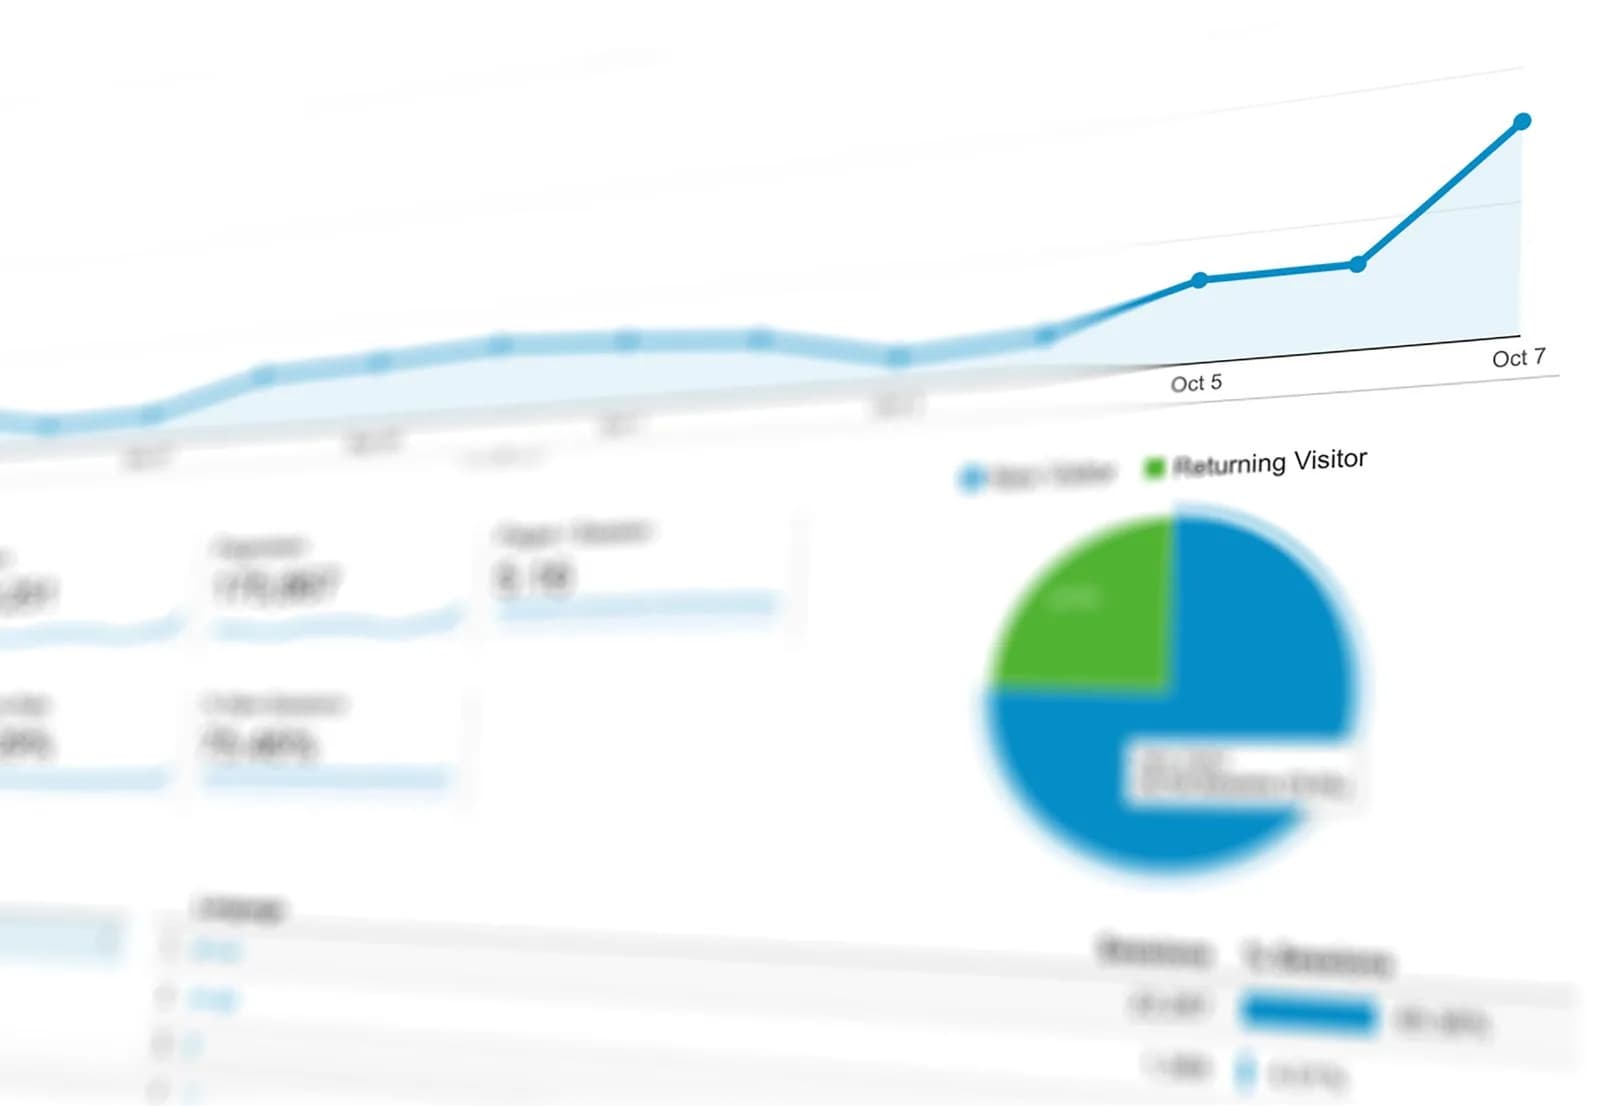
The short answer: A Business Intelligence (BI) dashboard is a single screen that pulls your most important business numbers from their scattered sources — sales, inventory, marketing, finance — and displays them visually and in real time, helping you see the full picture and decide in seconds instead of spending hours assembling manual reports. Instead of waiting for a late monthly report, you see your performance now and act before it's too late.
What's the difference between a report and a dashboard?
A traditional report is static, prepared manually once a week or month, and often reaches you after the opportunity has passed. A dashboard is live and continuously updated: it connects directly to your systems (point of sale, accounting, e-commerce store, CRM) and refreshes the numbers automatically. You can move between periods, filter by branch, product, or channel, and trace a problem to its root with a single click.
Why does your Saudi business need a dashboard?
- Faster decisions: You see performance in real time and act before a problem grows, not a month later.
- A single source of truth: The "which number is correct?" debate ends because everyone looks at the same source.
- Spotting opportunities: Sales patterns, most profitable products, and highest-return channels become clearly visible.
- Saving time: Your team stops spending hours manually assembling numbers from scattered Excel files.
The key metrics your dashboard should show
Metrics vary by the nature of your business, but most companies need to track:
- Revenue and growth: Daily and monthly sales and their growth rate versus the previous period.
- Profitability: Net profit margin, customer acquisition cost, and average order value.
- Customers: Number of new customers, retention rate, and repeat purchase rate.
- Operations: Inventory levels, order fulfillment time, and service quality indicators.
The golden rule: a dashboard crowded with dozens of numbers goes unread. Choose the metrics that actually drive a decision and drop the rest — a metric that doesn't change your behavior is noise.
Steps to build an effective dashboard
- 1. Define the decision questions: Start from the questions that keep you up at night ("which branch is losing? which product wins?"), not from the numbers you happen to have.
- 2. Gather your data sources: Connect your existing systems so numbers flow automatically without manual entry.
- 3. Clean and unify the data: Inaccurate data produces wrong decisions; unifying and cleaning is the foundation of trust.
- 4. Design the visualization: Clear charts, meaningful colors, and a layout that puts the most important items at the top.
- 5. Review and evolve: A dashboard is a living thing; remove what isn't used and add what new decisions require.
The expected return
When you base your decisions on accurate, real-time numbers instead of gut feeling, you catch problems earlier, stop unproductive spending, and double down on what works. Dashboards turn the data piling up in your systems from a neglected burden into a strategic asset that drives growth. This sits at the heart of Saudi Vision 2030's direction toward a data-driven economy and sound institutional decision-making.
Origami's role
At Origami we connect your scattered systems into a single source and build custom dashboards that show the metrics that truly matter to your business — updated in real time and easy to read. Our goal is for you to open one screen in the morning and see the full state of your company, then decide with confidence — not drown in conflicting Excel files. We design the dashboard around your decisions, not around whatever the systems happen to output.
This is an experimental article. Please verify its information against trusted official sources before relying on it.
Frequently Asked Questions
What is a BI dashboard?+
It's a single screen that pulls your most important business numbers from scattered sources like sales, inventory, and finance, and displays them visually and in real time. It connects directly to your systems and refreshes automatically, helping you see your company's performance now and decide quickly instead of waiting for late monthly reports.
What's the difference between a report and a dashboard?+
A report is static, prepared manually once a period, and usually reaches you late, while a dashboard is live and connected to your systems, refreshing numbers automatically. You can move between periods, filter by branch or product, and trace a problem's root with a click — something a static report can't offer.
Which metrics should I track on my dashboard?+
Start with metrics that drive a real decision: revenue and its growth, profit margin, customer acquisition cost, customer retention rate, and inventory levels. Avoid crowding the dashboard with dozens of numbers; a metric that doesn't change your behavior is noise that should be removed.
Do I need a large technical team to build a dashboard?+
No. You need a partner to connect your existing systems, clean your data, and design the dashboard around your decision questions. A company like Origami handles this integration and design, so you get a ready, real-time dashboard without building an internal data team from scratch.
Rate this article
Related Articles
- Data Analytics & AIFootball Data Analytics and AI: How Player Tracking Becomes Decisions at the World Cup 2026From player tracking to performance models, modern football turns data into decisions. See the analytics tech behind World Cup 2026 and what Saudi businesses can apply.
- Artificial IntelligenceAI in Procurement and Inventory: How It Saves Your Business Money and TimeDead stock and guesswork purchasing quietly drain the profits of many businesses. Learn how AI turns your data into sharper purchasing decisions and leaner inventory.
- Business SystemsThe Store That Markets Itself: How Q Turned Data and Content into a Growth EngineThe store that markets itself: how Q turned operational data into decisions and content into a growth engine. The final part of the series. Coming soon.
- CybersecurityCisco Antares: Open-Weight AI That Scans Your Code for Security Flaws, LocallyCisco released Antares, an open-weight model family that locates security vulnerabilities in code, runs on your own hardware, and costs 172x less than frontier models.
- Artificial IntelligenceQwen 3.8 Max: 2.4 Trillion Parameters — and What Alibaba Did Not SayAlibaba unveiled Qwen 3.8 Max with 2.4 trillion parameters and claimed second place globally. Here is what was announced, what was not, and how to read any model launch.
- Artificial IntelligenceThe 2026 AI Price War: Why AI Just Got Much Cheaper and What It Means for Your BusinessIn July 2026 AI prices collapsed after GPT-5.6, Gemini Flash, and open-source models launched. What falling AI costs mean for your Saudi business budget and product decisions.
Weekly newsletter
The latest articles that matter to business owners, once a week. Just your email.
Looking for a software solution for your business?
At Origami we build custom systems, websites, and stores tailored to how your business works. Get in touch and we'll show you how we can help.
